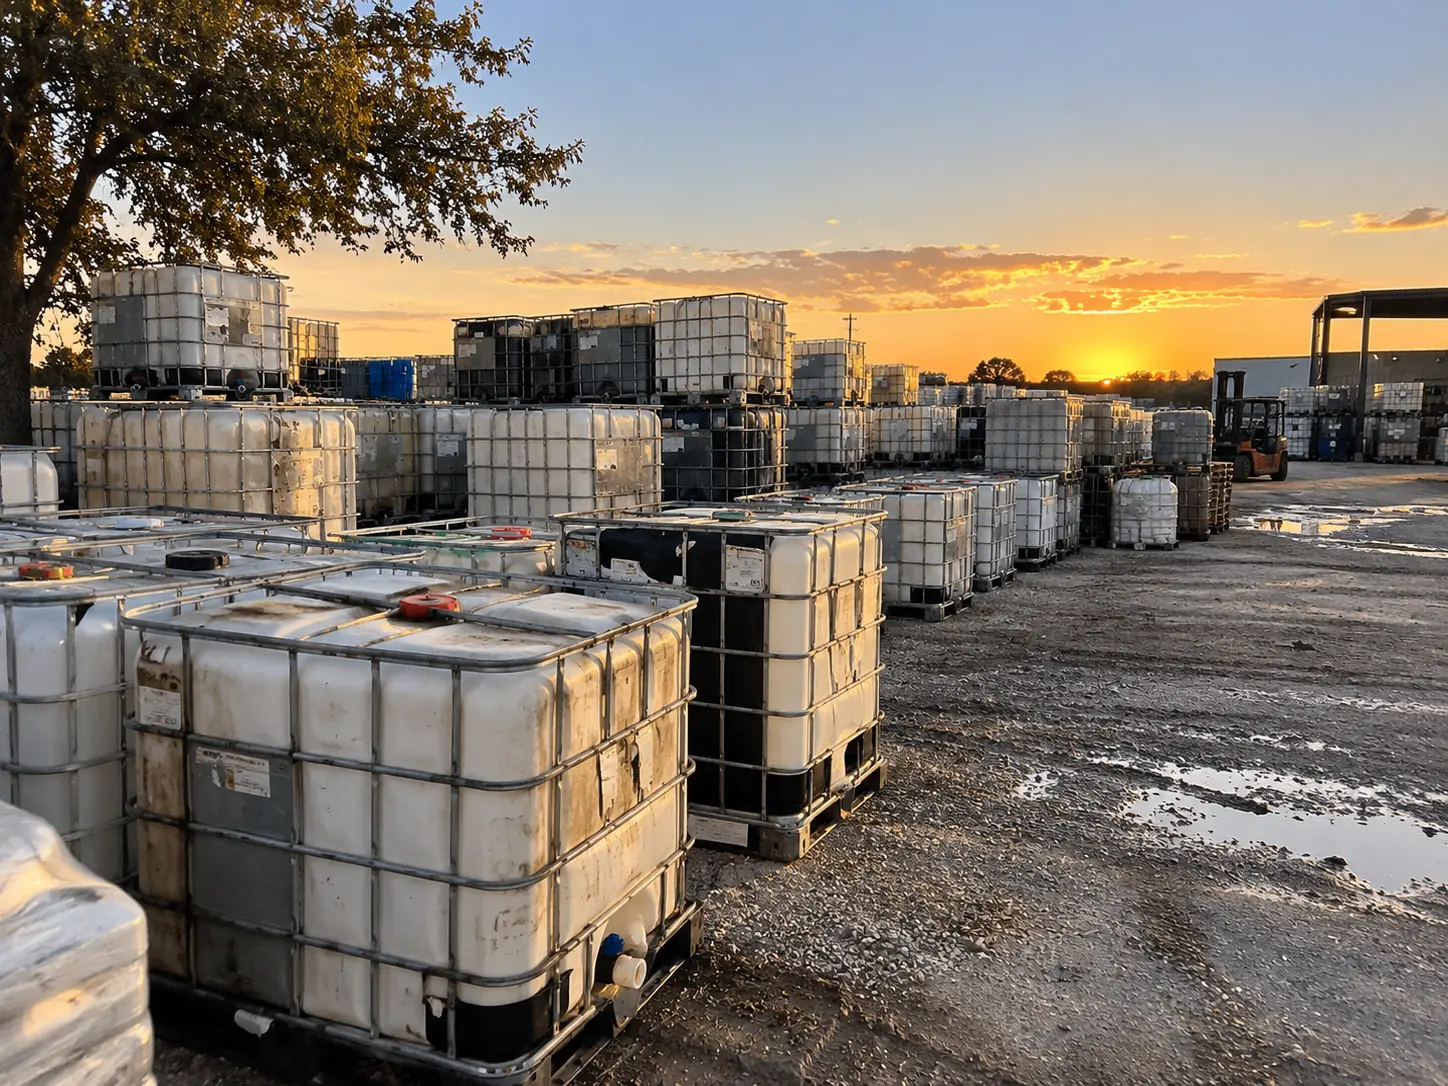
We grade individually rather than by lot, which means every unit that has passed through this building since 2015 has a record. That was never intended as a dataset. It has become one, and some of what it shows is genuinely counterintuitive.
Pattern one: the reuse rate is higher than anyone expects
93.9% of intake returns to service as a container. Not as flake, not as scrap — as a working IBC tote. When we tell people this, the common reaction is scepticism, because the units arriving here look rough.
They look rough because of cosmetic weathering, which has almost no relationship to whether a bottle holds pressure. Appearance and integrity are nearly independent variables, and that single fact is the most commercially important thing in this dataset.
| Year | Reuse rate | Primary driver of improvement |
|---|---|---|
| 2016 | 88.1% | Baseline |
| 2018 | 90.2% | Better residue-matched wash programmes |
| 2020 | 90.4% | Flat — pandemic-year intake mix |
| 2022 | 92.8% | Grading consistency, second-check at staging |
| 2024 | 93.7% | Continued grading refinement |
| 2025 | 93.9% | Approaching the practical ceiling |
The gains since 2016 come almost entirely from better grading rather than better washing. We expected the opposite when we invested in the wash line.
Pattern two: the cage outlives the bottle three to one
Across our rebottling history, a single reclaimed steel cage carries three bottles through their full service lives before the cage itself retires. The cage reuse rate is 98.4% against 93.9% for bottles, and cage failures are overwhelmingly impact damage rather than fatigue.
This is the finding that justifies the rebottling line, and it was not obvious in advance. The intuition is that steel is durable and plastic is not; the data says the gap is wider than that intuition suggests.
Pattern three: previous contents predict outcome better than age
We tracked both for several years expecting age to dominate. It does not. A ten-year-old bottle that held fertiliser outperforms a three-year-old bottle that held a solvent adjuvant, consistently.
- 1
- Best predictor: previous contents
- 2
- Second: storage conditions
- 3
- Third: fill count
- 4
- Fourth: age
Age ranks fourth. It correlates with condition because older units have usually had more fills and more weathering, but as a standalone predictor it is weak — which is why we stopped asking about it first.
Pattern four: storage conditions matter more than we thought
Units that spent their idle time indoors or under cover outperform outdoor-stored units substantially on pressure test pass rate, and the gap widens with time stored. Ultraviolet embrittlement is a slow, invisible process that produces a sudden test failure.
Practical consequence: when we buy, we now ask how long units have been standing and whether they were covered. It is a better question than how old they are.
Pattern five: valve failure dominates component replacement
| Component | Replacement rate | Primary cause |
|---|---|---|
| Valve gasket | 71% | Chemical attack, compression set |
| Discharge valve | 61% | Chemical attack on the body or seat |
| Fill cap and seal | 44% | Seal perishing, missing caps |
| Pallet base | 9% | Foot cracking, timber failure |
| Cage section repair | 4% | Impact deformation |
The top two rows are the only consistent consumption of new virgin plastic in our process, and we have found no reliable way to recondition a chemically attacked elastomer seal. It is published in our impact report as a known weakness.
Pattern six: cleanouts are better than they look
Twenty to forty percent of what arrives labelled as scrap is reusable or rebottlable. Across our cleanout history, roughly three quarters of jobs settle as a credit to the customer rather than a cost.
The reason is the same as pattern one: weathering is cosmetic, and a bottle that has sat empty under a tarp for six years usually still holds pressure.
Pattern seven: grading drift is real and fixable
A technician working through four hundred units develops a slightly looser or tighter internal standard across a shift. We found this by comparing first-pass and second-check grades and seeing a systematic within-shift pattern rather than random noise.
The fix was the second check at staging, by a different technician. It moved our mis-grade rate from the low single digits to 0.4% and it was the single highest-return process change we have made.
Pattern eight: the service-life curve flattens early
Embodied carbon per trip falls steeply for the first few reuses and then flattens, because our own process cost becomes the dominant term past about six cycles.
| Service lives | Embodied per trip | Process per trip | Total |
|---|---|---|---|
| 1 | 315 lb | 0 lb | 315 lb |
| 2 | 158 lb | 53 lb | 211 lb |
| 4 | 79 lb | 53 lb | 132 lb |
| 6 | 53 lb | 53 lb | 106 lb |
| 12 | 26 lb | 53 lb | 79 lb |
| 19 | 17 lb | 53 lb | 70 lb |
Which tells us where to invest. Past six reuses, extending service life further delivers diminishing returns, and the leverage moves to water heating efficiency and freight consolidation.
The three things we were wrong about
- 01We thought washing was the bottleneck on reuse rate. It was grading. Every percentage point of improvement since 2016 came from better assessment, not better cleaning.
- 02We thought age was the main thing buyers should ask about. It ranks fourth, behind previous contents, storage conditions and fill count.
- 03We thought upcycled builds would be a marginal curiosity. They take 2.4% of intake — bottles that would otherwise be granulated — and they typically outlast their original chemical service life by a decade.
The first of those was expensive to learn, because we had already bought the wash line. It is a good wash line. It just was not the constraint.
What we still do not know
One significant gap, and it is structural rather than fixable with more data collection. Our observed service lives come from units that came back to us. Units that went out and never returned are invisible — they may have been reused elsewhere, or landfilled by a third party, and we cannot distinguish the two.
Which means every service-life figure here carries an unmeasurable selection bias. We state it in the methodology rather than pretending the dataset is complete, because it is the one weakness in this data that sixteen more years will not close.