§ 02.3aSustainability / Methodology
Calculation
methodology.
The technical appendix. System boundaries, allocation rules, factor derivations, substitution ratios and the four places where our model is weakest. If you are checking our arithmetic, this is the page you want.
- Boundary
- Cradle to gate + our operation
- Functional unit
- One 275-gal composite IBC
- Allocation
- Mass-based, components
- Model version
- 2025.1
§ 02.3a.1System boundary
What is inside the calculation and what is not.
Functional unit
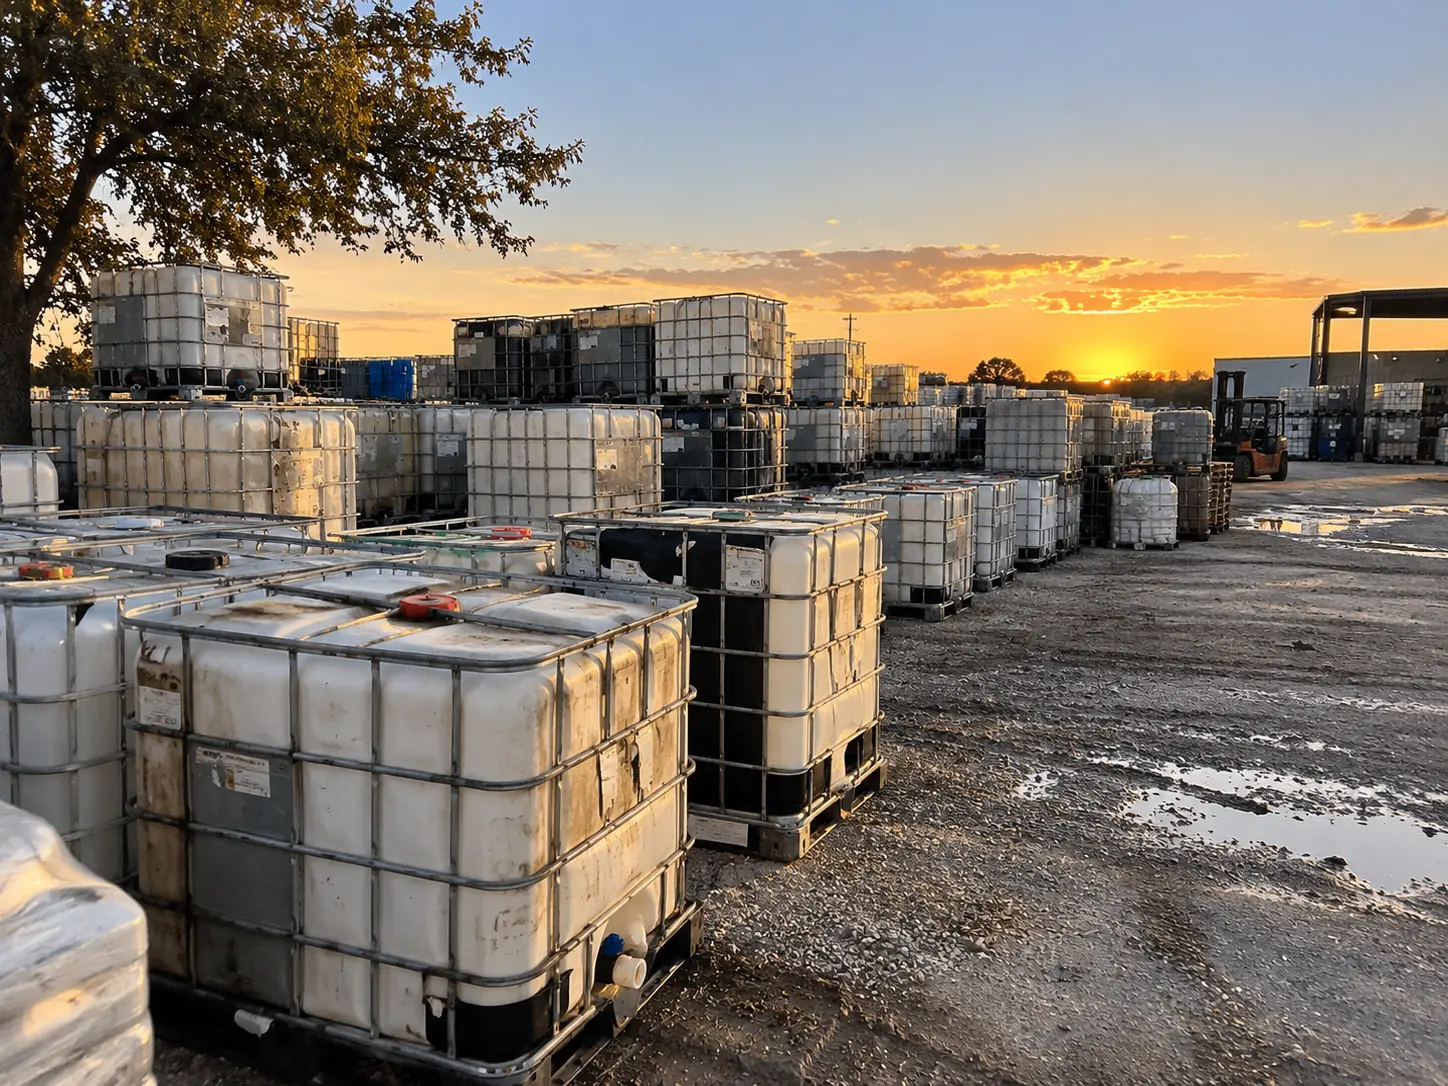
One 275-gallon composite IBC tote (31HA1 design type) delivering one service life as a liquid transport container. All figures are per functional unit unless stated otherwise.
Included in the baseline
- HDPE polymerisation, pelletizing and transport to moulder
- Bottle blow moulding, including scrap rate at the moulder
- Steel tube drawing, cutting, welding and hot-dip galvanising
- Pallet manufacture, weighted across plastic, steel and timber formats
- Assembly, labelling and inbound freight from assembler to filler
Included in our own path
- Inbound collection freight from customer site to Harvey
- Weigh, grading and handling energy
- Wash water heating and pumping, net of 92% recirculation
- Test rig energy and compressed air
- Replacement valve, gasket and cap production where fitted
- Outbound freight from Harvey to receiving customer
Excluded
- Capital goods — the building, the granulator, the trailers
- Employee commuting and business travel
- Customer-side filling, use and cleaning
- End-of-life of the liquid product itself
- Any avoided landfill methane or leachate management
The last exclusion is material and it works against us. Avoided landfill emissions are a genuine benefit of diversion that our figures do not claim.
Allocation rules
- Component allocationBaseline impact is allocated across bottle, cage, pallet and assembly by the mass-and-process shares in the table below, so a rebottled unit can be credited for the components that actually survived.
- Multi-life amortisationWhere we quote a per-trip figure, embodied impact is divided evenly across observed service lives. We do not front-load or discount later lives.
- Recycled content substitutionRecovered HDPE is credited at a 1.0 substitution ratio against virgin resin. This is the most aggressive assumption in our model — see weaknesses below.
- Freight allocationCollection and delivery freight is allocated per unit on a full-trailer basis (48 units). Partial loads carry their actual share, which is worse per unit.
§ 02.3a.2Derivations
From component masses to published factors.
| Component | Mass (lb) | Process intensity (lb CO₂e/lb) | lb CO₂e | Share |
|---|---|---|---|---|
| HDPE bottle | 38 | 3.32 | 126 | 40.0% |
| Galvanised steel cage | 70 | 1.89 | 132 | 41.9% |
| Pallet base (weighted) | 32 | 1.09 | 35 | 11.1% |
| Assembly & inbound freight | — | — | 22 | 7.0% |
| Total baseline | 140 | — | 315 | 100% |
| Path | Our process impact (lb CO₂e) | Components retained | Credit (lb CO₂e) | Published saving |
|---|---|---|---|---|
| Reuse | 53 | Bottle + cage + pallet | 315 | 262 |
| Rebottle | 139 | Cage + pallet | 315 | 176 |
| Reprocess | 73 | Resin value only | 126 | 53 |
Published saving is credit minus process impact, rounded to the nearest pound. The reprocess row credits only the bottle's resin component because the cage and pallet are accounted separately in the reuse stream.
| Element | Factor | Basis |
|---|---|---|
| Virgin HDPE production water | 49 gal / lb resin | Supplier EPD water footprint, 2024 |
| Resin per bottle | 38 lb | Measured average, 275-gal composite |
| Gross water per bottle avoided | 1,862 gal | 49 × 38 |
| Our wash draw, gross | 148 gal / unit | Wash-line metering, FY2024 |
| Recirculation recovery | 92% | Metered return volume |
| Our net wash draw | 11.8 gal / unit | 148 × 0.08 |
| Allocation to bottle component | 42.5% | Mass-and-process share of water intensity |
| Published reuse water saving | 786 gal | Net of our draw and allocation |
§ 02.3a.3Known weaknesses
Four places this model is soft.
Every impact model has soft joints. Pretending otherwise is how sustainability reporting lost its credibility.
1 · Substitution ratio of 1.0
We credit recovered HDPE as displacing virgin resin pound for pound. Recycled HDPE frequently substitutes at a discount because of quality constraints. Our flake is single-stream and hot-washed, which justifies a high ratio, but 1.0 is the top of the defensible range. A conservative reader should discount our reprocess CO₂e figure by up to 20%.
2 · Pallet weighting
Our pallet baseline is a weighted average across plastic, steel and timber, drawn from our own intake mix. A customer whose fleet is entirely timber-palletised has a materially different baseline, and our single figure will overstate their saving.
3 · Full-trailer freight assumption
Per-unit freight is allocated across 48 units. Small pickups in distance band D or E carry far worse per-unit freight than our published figures imply. We do not currently publish a band-adjusted factor, and we should.
4 · Service-life observation bias
Our observed service lives come from units that returned to us. Units that went out and never came back are invisible to the model — they may have been reused elsewhere, or they may have been landfilled by a third party. We cannot distinguish the two.
Back to the numbers
Now that you know how it's built, go run it.
The live ledger applies exactly these factors, with no additional adjustment.
Related reading: The carbon math of reusing a tote · Impact Report